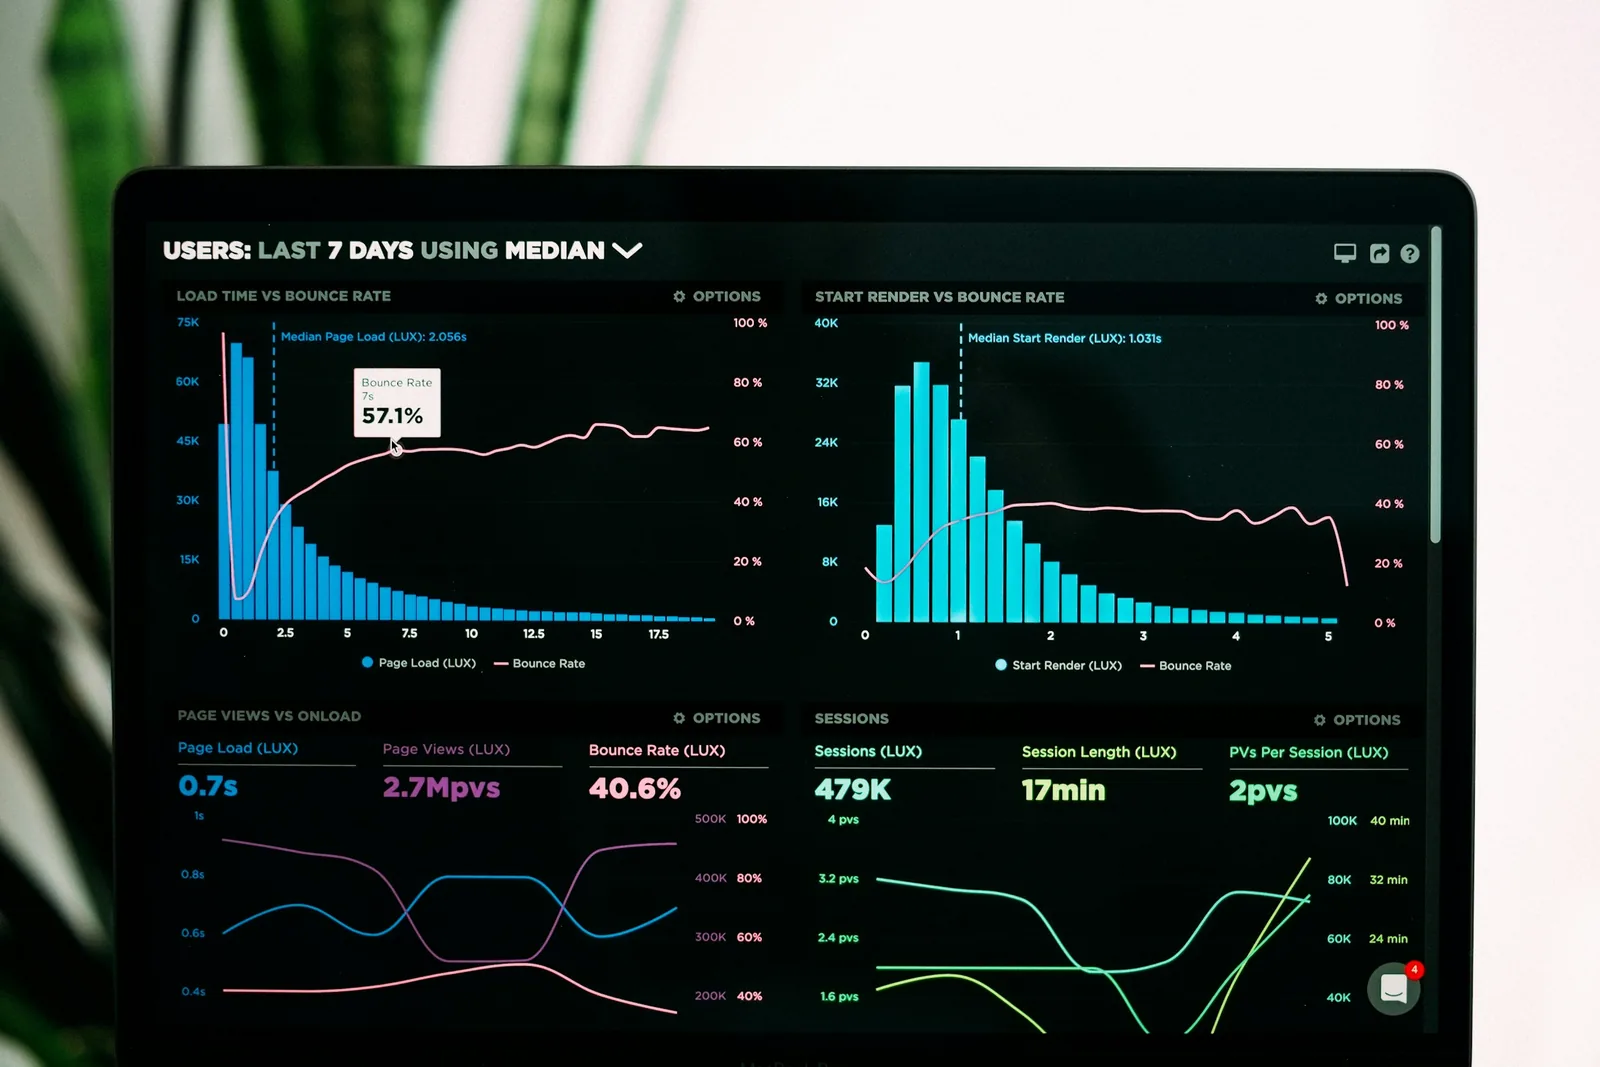
Devices produce a stream of small, timestamped records. On its own that stream is almost worthless. The value comes from what happens next: validating the records, storing them where they can be queried, computing something from them, and triggering an action when the computation says so. The chain of components that does this is the data pipeline, and it is where most of the engineering effort in a mature IoT system ends up.
IoT pipelines differ from general data engineering in a few ways. The data arrives continuously and out of order, from devices with unreliable clocks and intermittent connectivity. Volume is device count multiplied by sampling rate. And many decisions need to be made within seconds of the data arriving, not in a nightly batch.
This guide walks through the stages in order and highlights the choices that determine whether a pipeline holds up at scale.
Ingestion
Data ingestion is the boundary where device messages enter the back end. Typically a broker or gateway service receives messages over MQTT, CoAP or HTTP, and hands them to the pipeline.
Several things should happen at this boundary and nowhere else. The sender is authenticated, and the message is tagged with the verified device identity rather than whatever the payload claims. The payload is decoded, whether JSON, CBOR or Protocol Buffers, and validated against a schema. Metadata is attached: device type, firmware version, customer, site. And a server-side receipt timestamp is recorded next to the device’s own timestamp, because device clocks drift and batteries die.
A common pattern is to publish each validated message onto a message queue or log so that downstream consumers can process it independently. This decouples ingestion from processing: if the analytics service is slow, messages queue up rather than being dropped at the broker.
Hot path and cold path
Most pipelines split in two after ingestion. The hot path handles data that needs an answer in seconds: alarm thresholds, live dashboards, commands to actuators. The cold path handles everything that can wait: long-term storage, reporting, model training.
The hot path uses stream processing, which evaluates each record or small window of records as it arrives. Typical operations are filtering (drop readings outside a plausible range), enrichment (join the device ID to a location), windowed aggregation (average over the last five minutes) and pattern detection (three consecutive readings above a limit). A rule engine in an IoT platform is a simplified stream processor.
The cold path uses batch processing: periodic jobs that read a day or a month of stored data, compute aggregates and reports, and feed ETL into a warehouse. Batch jobs are cheaper per record, so anything that does not need low latency should go there.
Event-driven architecture ties the two together: the hot path emits events such as “threshold crossed” or “device went silent”, and other services subscribe to those events rather than to raw telemetry.
Storage
IoT data is time-series data: a value, a timestamp and a set of tags identifying the source. A relational database can store it but struggles with the write rate and the query pattern, which is almost always “this metric, these devices, this time range, aggregated by interval”. A time-series database is built for exactly that, with compression tuned to slowly changing numbers and query functions for windowed aggregates.
Three decisions dominate storage design.
Retention. Raw high-frequency data is large and rarely useful after a few weeks. A data retention policy keeps raw data for a short window, downsampled aggregates for longer, and summary statistics indefinitely. Regulations may impose minimums or maximums.
Partitioning. Data is partitioned by time and often by tenant so that old partitions can be dropped cheaply and queries touch only the ranges they need.
Cold storage. Full history goes to a data lake on object storage in an open columnar format, where it is cheap to keep and available for model training and ad hoc analysis.
Alongside the time series, the pipeline keeps the current state of each device, usually in a device shadow document, so that applications can answer “what is the state now” without scanning history.
Processing and analytics
With data flowing and stored, the pipeline computes things. The simple cases are thresholds and KPIs: energy per day, uptime per machine, OEE per line. These are typically stream aggregations written to the time-series store and shown on a dashboard.
The harder cases involve machine learning. Anomaly detection learns normal behavior and flags deviations, which is useful when nobody can write down the threshold in advance. Predictive maintenance models estimate time to failure from vibration, temperature and load history. These models are trained in batch on the data lake and then deployed either in the stream processor or, increasingly, on the edge where they can act without a round trip to the cloud. The guide on predictive maintenance with IoT and AI covers this workflow, and MLOps practices handle retraining when model drift sets in.
Action
The final stage closes the loop. Actions take three forms. Notifications reach people through alerts, tickets or messages, and the main design problem is avoiding alert fatigue by deduplicating, grouping and applying hysteresis so that a value hovering around a threshold does not generate a hundred alarms. Integrations push events to other systems through webhooks and APIs: a maintenance work order, a billing record, an inventory update. Commands go back to devices, published to a command topic that the device firmware acts on, with the result reported back so the shadow reflects reality.
An automated rule that can switch physical equipment should have limits on rate and scope, an audit trail, and a human override. A bug that turns a heater on and off every second is a safety problem, not just a data problem.
Where the edge fits
Not all of this has to happen in the cloud. Edge analytics moves the hot path, or part of it, onto a gateway or the device. Filtering and downsampling at the edge cut bandwidth; local rules keep working during outages; running inference locally avoids sending raw video or audio anywhere. The cold path still ends up centrally, because training and cross-site comparison need all the data in one place. Deciding the split is the subject of edge vs cloud vs fog.
Operating the pipeline
A pipeline is a production system and fails in production ways. The signals worth monitoring are ingestion rate versus expected rate (a sudden drop means devices or network are failing), end-to-end latency from device timestamp to action, queue depth (growing depth means a consumer is falling behind), and the count of devices that have not reported within their expected interval. Data governance questions, who can access what and how personal data is handled, should be settled before the first record is stored.
Where to go next
- IoT platforms explained describes the managed services that implement the ingestion and rules stages.
- Edge vs cloud vs fog helps decide which stages to move closer to the devices.
- Digital twins explained covers the model that sits on top of a mature pipeline.
- Predictive maintenance with IoT and AI shows the pipeline applied to a specific problem.
Topics: data, pipeline, time series, stream processing, architecture